Note
This Python sample may be slow depending on the event rate of the scene and the configuration of the algorithm. We provide it to allow quick prototyping. For better performance, look at the corresponding C++ sample.
Vibration Estimation using Python
The Python bindings of Metavision Analytics API can be used to estimate the frequency of vibrating objects.
The sample metavision_vibration_estimation.py shows how to use the python bindings of Metavision Analytics SDK to compute:
a frequency map, that is a per-pixel estimation of the frequency of the received events
the dominant frequency among all pixels, that is the most common frequency.
This sample also allows computing the dominant frequency in ROIs and checking the frequency at specific locations (i.e. pixel by pixel) in the frequency map.
The source code of this sample can be found in <install-prefix>/share/metavision/sdk/analytics/python_samples/metavision_vibration_estimation
when installing Metavision SDK from installer or packages. For other deployment methods, check the page
Path of Samples.
Expected Output
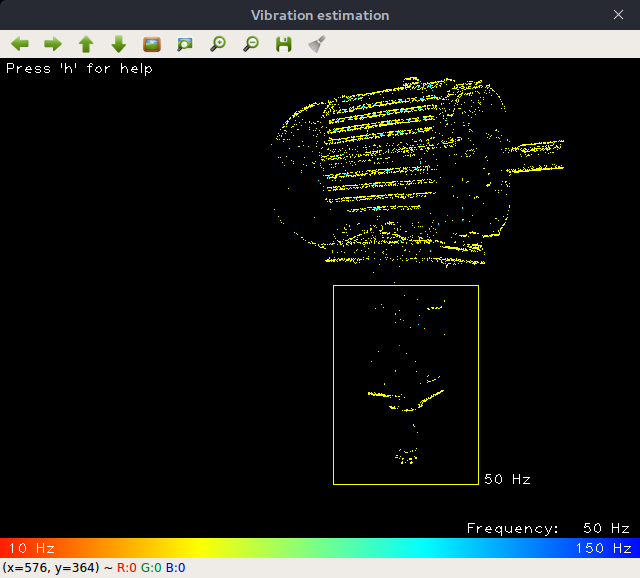
Metavision Vibration Estimation sample visualizes the frequency map (i.e. frequency estimated per pixel), the dominant frequency in the camera’s FOV, and selected ROI(s) with their frequency(ies):
The sample allows the following interactions:
selecting an ROI (with mouse click and drag) for which the dominant frequency will be shown next to the ROI
moving a mouse pointer over vibrating pixels to see frequency pixel by pixel
Setup and Requirements
Some requirements are related to default optics (lens) used on Prophesee cameras. If we consider a default optic of 8mm focal length (EVK4 default lens for example):
minimum distance from the sensor to the vibrating object should be 10cm
vibration amplitude should be at least 1 pixel (as FOV per pixel will be 63µm at the minimum distance, then the minimum amplitude should be about 125µm, when the object is at 10cm distance).
To estimate vibration with smaller amplitudes, you would need a lens with a longer focal length. For example, 16mm focal length will allow for an amplitude that is half as large.
Regardless of the optics, it is very important to get the vibrating object in focus to see sharp edges. For this, you would need to adjust the focus and/or the aperture of the lens.
How to start
To start the sample based on the live stream from your camera, run:
python metavision_vibration_estimation.py
To start the sample based on recorded data, provide the full path to a RAW file (here, we use a file from our Sample Recordings):
python metavision_vibration_estimation.py -i monitoring_40_50hz.raw
To check for additional options:
python metavision_vibration_estimation.py -h
Code Overview
Pipeline
Metavision Vibration Estimation sample implements the following pipeline:

Frequency Map Async Algorithm
The class metavision_sdk_analytics.FrequencyMapAsyncAlgorithm is used to generate a frequency map of the vibrating
objects from the CD events. The metavision_sdk_analytics.FrequencyMapAsyncAlgorithm is asynchronous in the sense that a
frequency map is not produced for each input buffer of events but rather at a fixed refresh rate in the camera’s clock.
So for each input buffer of events, 0, 1 or N frequency map(s) might be produced.
To retrieve the frequency map, we subscribe to the output callback of the
metavision_sdk_analytics.FrequencyMapAsyncAlgorithm.
Vibration GUI
This class is in charge of displaying the frequency map in a way that makes it easy for you to visualize the vibrating objects in the camera’s FOV.
Each input frequency map is converted to an RGB frame using the metavision_sdk_analytics.HeatMapFrameGeneratorAlgorithm
and a given color map. In addition, the dominant frequency of the scene is computed using the
metavision_sdk_analytics.DominantValueMapAlgorithm and printed in the RGB frame.
Furthermore, the GUI allows you to define ROIs in the frequency map by clicking and dragging. The dominant frequency inside that ROI is then automatically computed.
Finally, you can check the frequency pixel by pixel by pointing the mouse cursor at a specific location in the frequency map.
All the previously described processing is done synchronously, meaning that for each input frequency map, an RGB frame is displayed and all the user interactions are handled.
The following image shows an example of a frequency map displayed in the GUI and in which an ROI has been defined: